Item Mix
The Item Mix Pages can be found under Analytics in the Navigation Menu and are broken down into two pages: Top Item Sales and Top Category Sales. The Item Mix Pages offer several different ways to analyze and view your sales data by individual Items and by Categories. The Item Mix Pages display information based on two main organizing factors: Date Range and Location.
Item Mix can be useful for reviewing the success and shortcomings of specific Items and Categories over a given period of time, and over multiple locations. Some merchants enjoy the ability to view Items and Categories according to how much they are refunded, or which Categories of Items contain large tax burdens.
To select the Date or Date Range, locate the Date field in the upper right hand corner of the screen, click on it, and then select the time frame from the Date Selection Drop Down. If you select a Custom Range, select a Date Range within the calendar.
If your business has multiple locations, you will be able to sort the information by Location. Choose a Location by clicking the Location Drop Down at the top of the screen, and selecting the Location for which you want to review the Item Mix.
The selected Date Range and Location will determine the data that is displayed in the Sales Panels and Charts below.
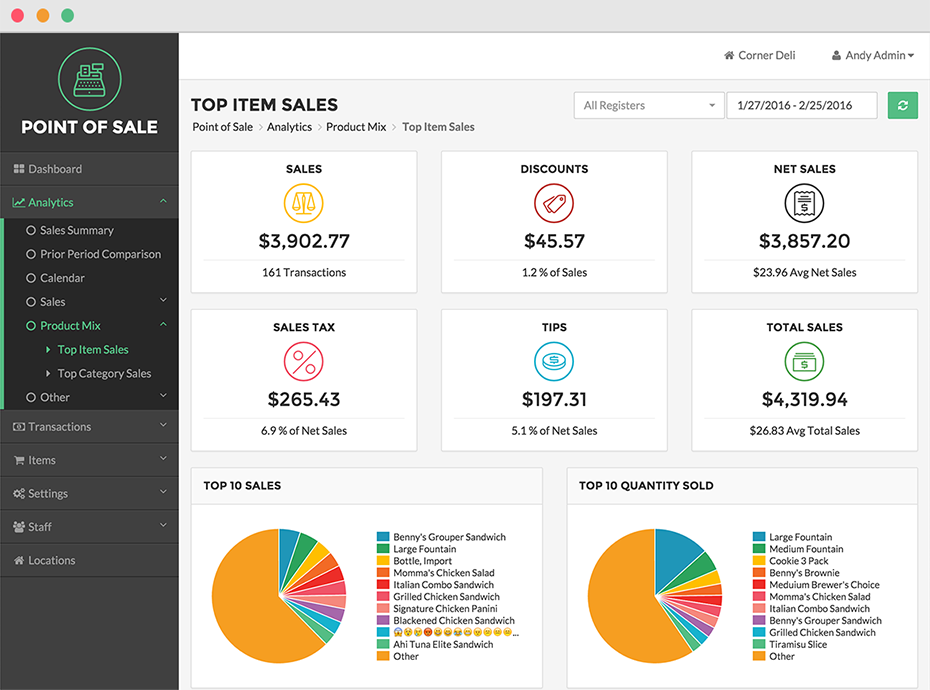
Top Item Sales
The Top Items Sales Page displays the Sales, Discounts, Net Sales, Sales Tax, Tips, and Total Sales Panels with data for the time period you have selected. The two pie charts below the panels represent your top ten Items by Sales and Quantity Sold. To see more information about a particular Item in the pie chart, hover your mouse over the corresponding section in the pie chart. To temporarily remove an Item from the pie chart, click the Item in the pie chart key. To re-insert the Item, click that Item again.
The table below the pie charts displays the Quantity of each Item sold against how many of those Items were refunded, the total Item sales, total Item refunds, total Discounts applied to the Item, and taxes paid on the Item. You can sort each of the columns in the table by clicking on the column name. Click the column name again to restore the original order.
Top Category Sales
The Top Category Sales Page displays the Sales, Discounts, Net Sales, Sales Tax, Tips, and Total Sales panels with information from the time period you have selected for your Top Category Sales. The two pie charts below the panels represent your top ten Categories by Sales and Quantity Sold. To see more information about a particular Category in the pie chart, hover your mouse over the corresponding section in the pie chart. To temporarily remove a Category from the pie chart, click the Category in the chart key. To re-insert the Category, click that Category again.
The table below the pie charts displays the Quantity of each Category sold against how many of those Category Items were refunded, the total Category sales, total Item refunds, total Discounts applied to the Category, and taxes paid on the Category. You can sort each of the columns in the table by clicking on the column name. Click the column name again to restore the original order.