Sales
Overview
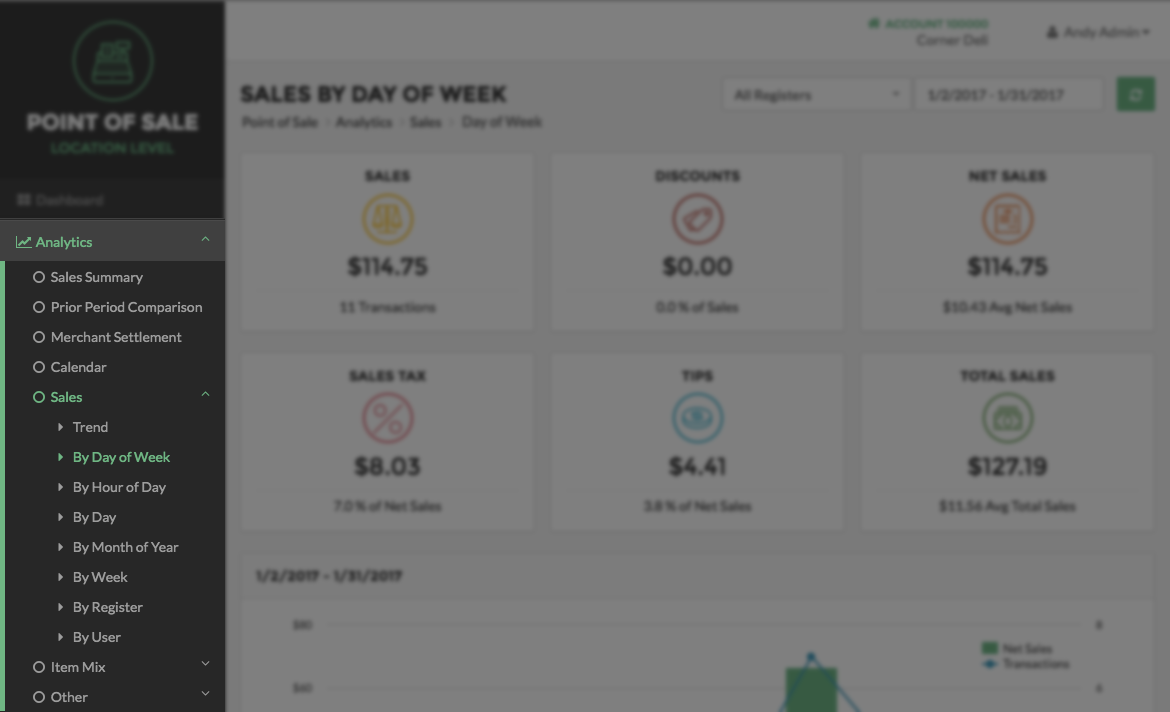
The Sales report option can be found under Analytics in the Navigation Menu. Under the Sales option, there are several different reports in an expanded menu from which you can choose to view. The different reports offer different ways to analyze and view your sales data. The Sales reports that can be viewed are: Trend, Day of Week, Hour of Day, Day, Month of Year, Week, Location, Register and User.
Sort by: Date, Location and Register
The information provided on the Sales report can be sorted in three different ways to help better refine your report:
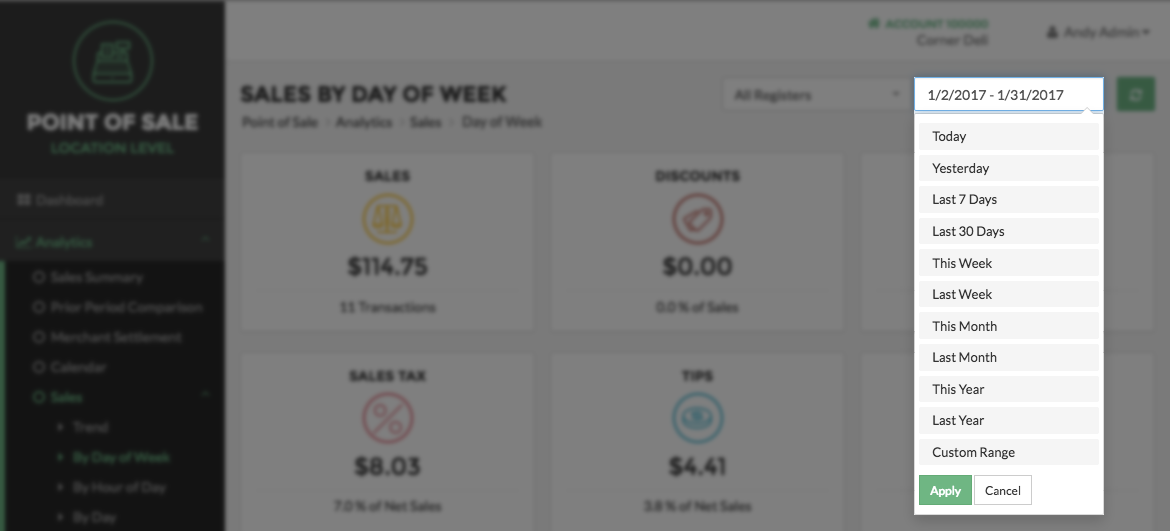
By Date
To sort the Sales data by Date, select the Date box in the top right of the screen. Choose a Date Range that can be as recent as Today, and as retroactive as Last Year. If you are searching for a specific Date Range, select Custom Range option, and then select a start and end date to the range. Click the Refresh Button when finished to load the results.
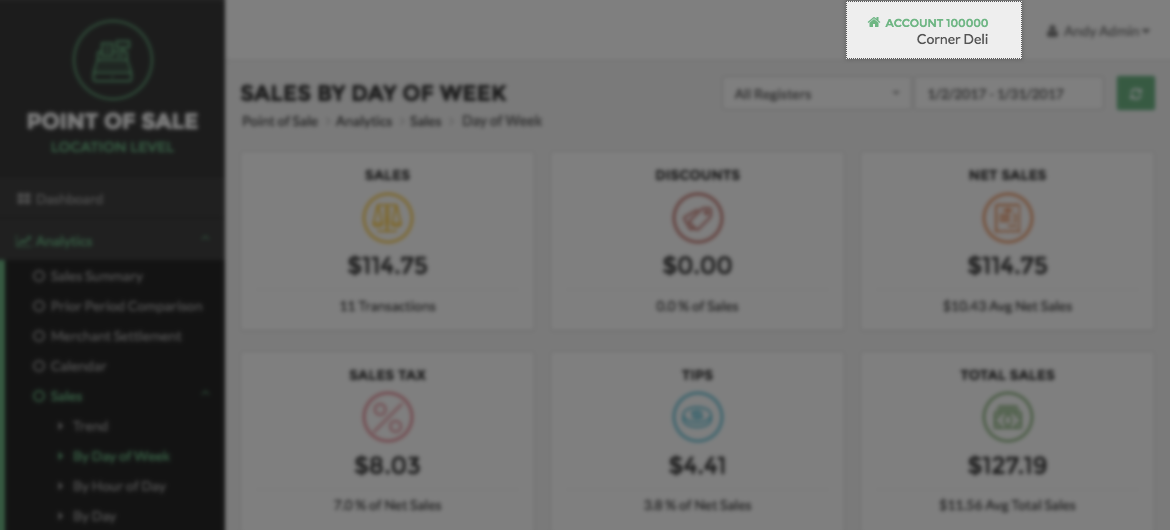
By Location
To sort Sales data by Location, select the Location drop down menu in the top right of the screen and choose a Location from the listings. If your business only has one Location, your Sales information will automatically be populated.
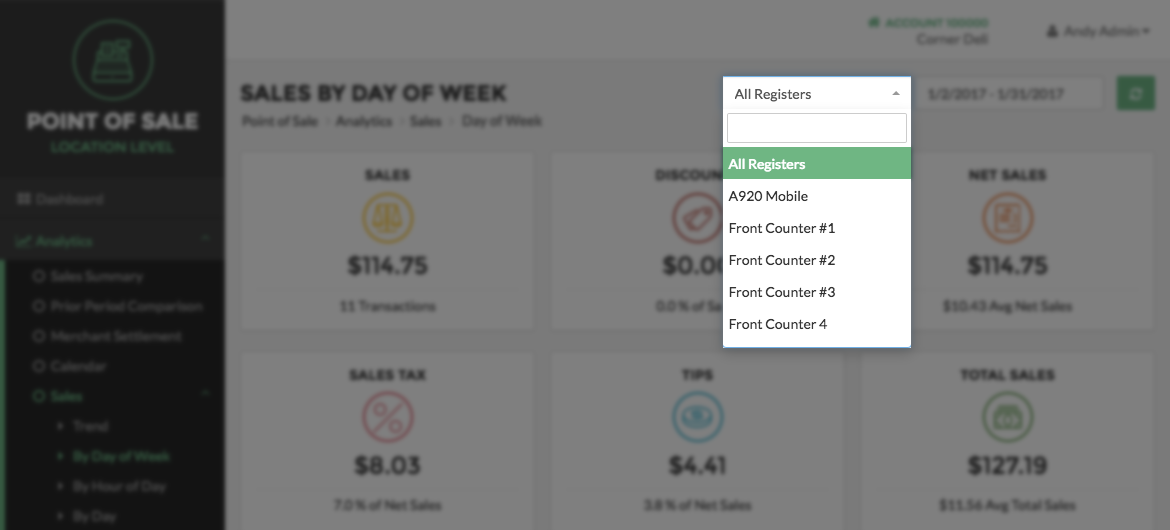
By Register
To sort Sales data by Register, select the Register option drop down menu in the top right of the screen and choose an option from the listings. Click the Refresh Button when finished to load the results.
Note:
The By Register option is only available in the Location context. If you're in an Account level or higher, you'll need to choose a location from the Locations dropdown menu at the top of the page.
Page Summary
Sales reports information is displayed in three different ways on the screen to better help you understand the being data presented:
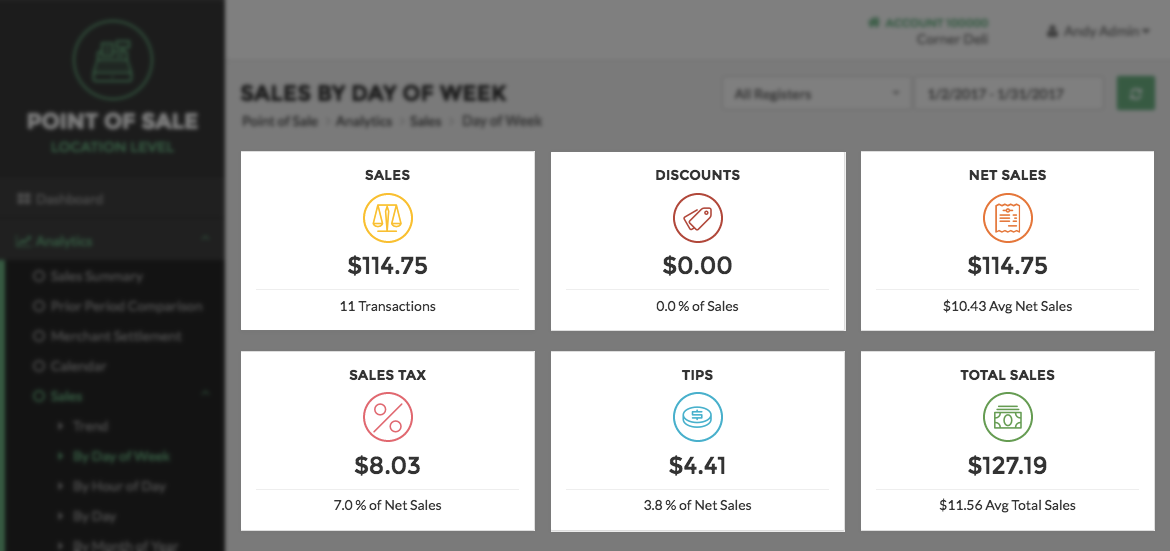
Panels
The first method is by panel. There are six panels: Sales, Discounts, Net Sales, Sales Tax, Tips, and Total Sales. According to the Date Range and Location you have selected, each panel represents a certain data set and contains an icon denoting the data it represents, a total number, and an additional number, usually a percentage of a total sum.
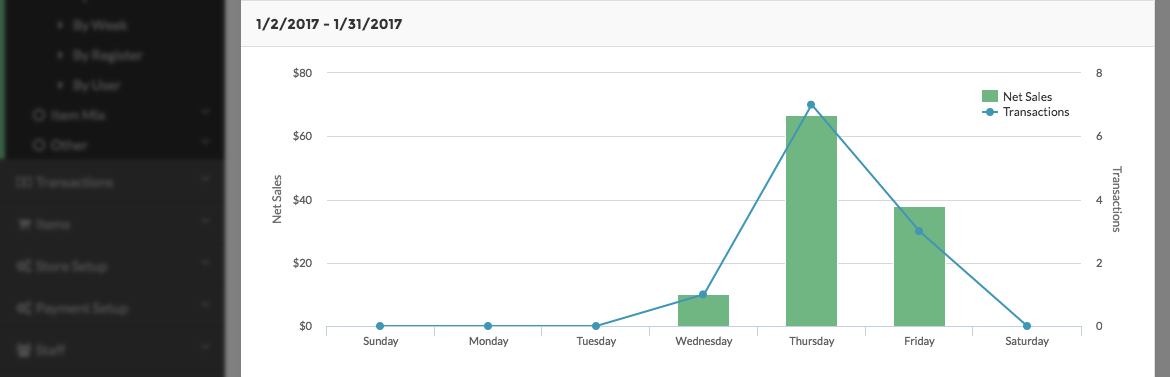
Chart
The second way Sales Data is displayed is by a chart. According to the Date Range and Location you have selected, the chart generally displays Net Sales and the number of Transactions. The only exception being the Trend Chart, which displays only Gross Sales.
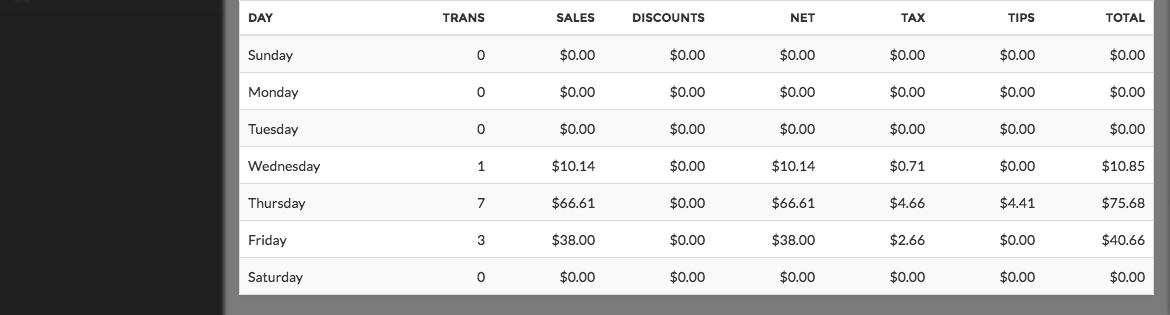
Table
The third and final way Sales Data is displayed is by a table. According to the Date Range and Location you have selected, the table sorts the information contained in the panels into table format. To sort the table by a certain column metric, click the Column Name. To return the column to its previous order, click the Column Name again.
Available Sales Reports
There are eight different sales reports that can be viewed under the Sales option in the Navigation Menu:
Trend
Unlike other Sales Reports that populate their charts with Net Sales and Transactions, the Sales Trend report displays Gross Sale information: Daily Gross Sales, Weekly Gross Sales, and Yearly Gross Sales.
Weekly Gross Sales are measured by days of the week and compared against the week immediately prior to the date you selected. Yearly Gross Sales are measured by month and compared against the year immediately proceeding the date you selected.
Sales by Day of the Week
The By Day of Week report displays information according to the Date Range you select, organized by the day of the week: Sunday through Saturday.
Sales by Hour of the Day
The By Hour of Day report displays information according to the Date Range you select, organized by hour of the day.
Sales by Day
The By Day report displays information according to the Date Range you select, organized by specific days, for example, each day between January 31-February 28.
Sales by Month of Year
The By Month report displays information according to the Date Range you select, organized on a monthly scale.
Sales by Week
The By Week report displays information according to the Date Range you select, organized on a weekly scale.
Sales by Location
The By Location report displays sales data on a Location-by-Location basis. If your business only has one Location, only one Location’s data will be populated. This feature is likely more useful for merchants with more than one Location. Multi-location merchants can view and compare sales metrics between each of their Locations.
Sales by Register
The By Register report displays sales data on a Register-by-Register basis. If your business only has one Register, only one Register’s data will be populated. This feature is likely more useful for merchants with more than one Register. Such a merchant can view different Registers and compare them in reference to numerous sales metrics.
Sales By User
The By user report displays sales data on a User-by-User basis. If your business only has one User, only one User’s data will be populated. This feature is likely more useful for merchants with multiple Users. Such a merchant can view different Users and compare them in reference to numerous sales metrics.